15.3. To Exascale and Beyond: Cloud Computing, Big Data, and the Future of Computing
Advances in technology have made it possible for humanity to produce data at a rate never seen before. Scientific instruments such as telescopes, biological sequencers, and sensors produce high-fidelity scientific data at low cost. As scientists struggle to analyze this "data deluge", they increasingly rely on sophisticated multinode supercomputers, which form the foundation of high-performance computing (HPC).
HPC applications are typically written in languages like C, C++, or Fortran, with multithreading and message passing enabled with libraries such as POSIX threads, OpenMP, and MPI. Thus far, the vast majority of this book has described architectural features, languages, and libraries commonly leveraged on HPC systems. Companies, national laboratories, and other organizations interested in advancing science typically use HPC systems and form the core of the computational science ecosystem.
Meanwhile, the proliferation of internet-enabled devices and the ubiquity of social media have caused humanity to effortlessly produce large volumes of online multimedia, in the form of web pages, pictures, videos, tweets, and social media posts. It is estimated that 90% of all online data was produced in the past two years, and that society produces 30 terabytes of user data per second (or 2.5 exabytes per day). The deluge of user data offers companies and organizations a wealth of information about the habits, interests, and behavior of its users, and it facilitates the construction of data-rich customer profiles to better tailor commercial products and services. To analyze user data, companies typically rely on multinode data centers that share many of the hardware architecture components of typical supercomputers. However, these data centers rely on a different software stack designed specifically for internet-based data. The computer systems used for the storage and analysis of large-scale internet-based data are sometimes referred to as high-end data analysis (HDA) systems. Companies like Amazon, Google, Microsoft, and Facebook have a vested interest in the analysis of internet data, and form the core of the data analytics ecosystem. The HDA and data analytics revolution started around 2010, and now is a dominant area of cloud computing research.
Figure 1 highlights the key differences in software utilized by the HDA and HPC communities. Note that both communities use similar cluster hardware that follows a distributed memory model, where each compute node typically has one or more multicore processors and frequently a GPU. The cluster hardware typically includes a distributed filesystem that allows users and applications common access to files that reside locally on multiple nodes in the cluster.
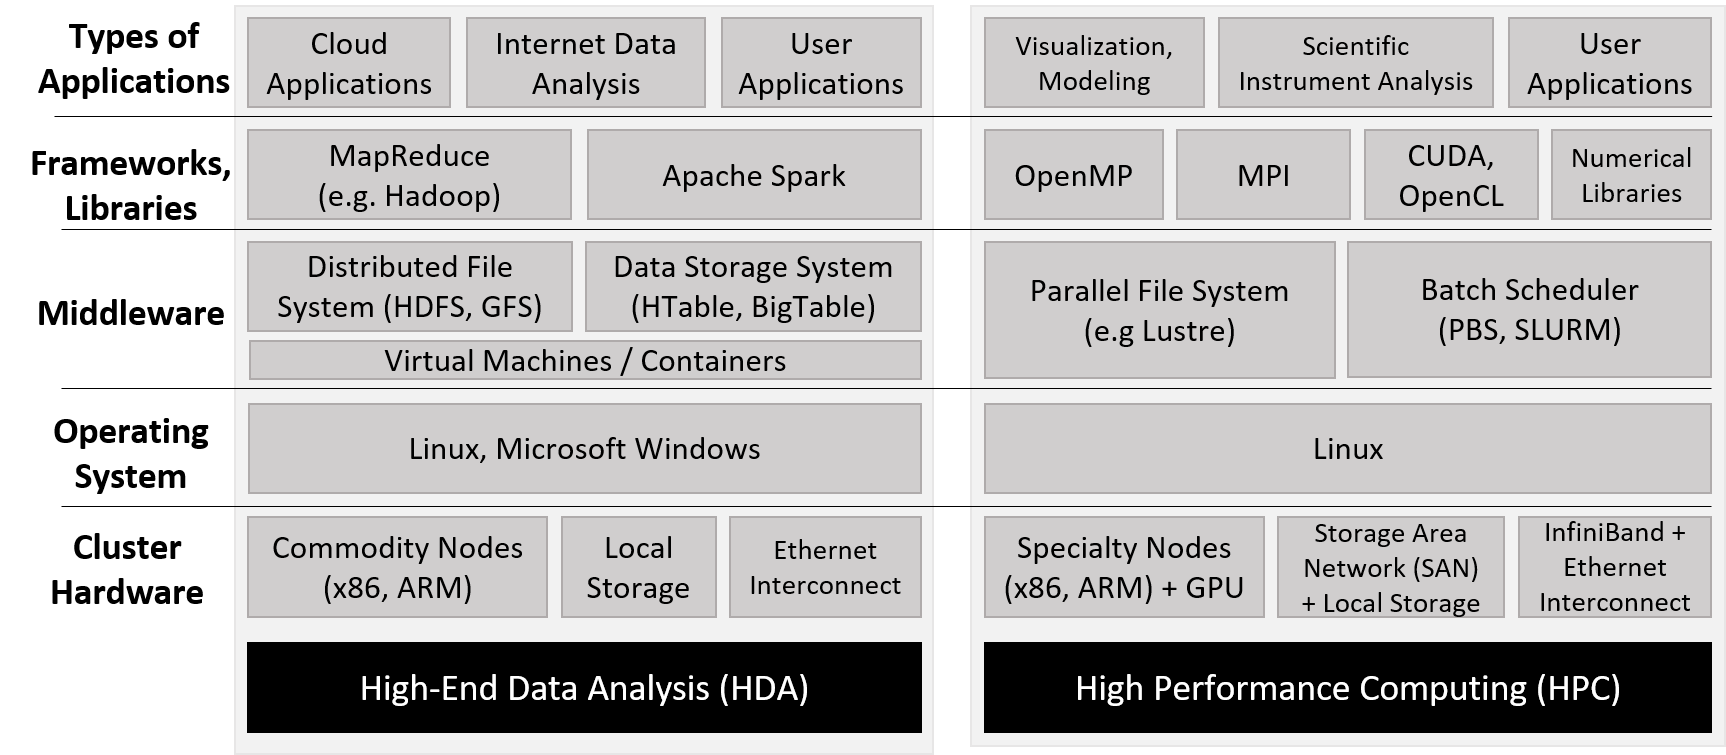
Unlike supercomputers, which are typically built and optimized for HPC use, the HDA community relies on data centers, which consist of a large collection of general-purpose compute nodes typically networked together via Ethernet. At a software level, data centers typically employ virtual machines, large distributed databases, and frameworks that enable high-throughput analysis of internet data. The term cloud refers to the data storage and computing power components of HDA data centers.
In this section, we take a brief look at cloud computing, some of the software commonly used to enable cloud computing (specifically MapReduce), and some challenges for the future. Please note that this section is not meant to be an in-depth look at these concepts; we encourage interested readers to explore the referenced sources for greater detail.
15.3.1. Cloud Computing
Cloud computing is the use or lease of the cloud for a variety of services. Cloud computing enables computing infrastructure to act as a "utility": a few central providers give users and organizations access to (a seemingly infinite amount of) compute power through the internet, with users and organizations choosing to use as much as they want and paying according to their level of use. Cloud computing has three main pillars: software as a service (SaaS), infrastructure as a service (IaaS), and platform as a service (PaaS)1.
Software as a Service
Software as a service (SaaS) refers to software provided directly to users through the cloud. Most people utilize this pillar of cloud computing without even realizing it. Applications that many people use daily (e.g., web mail, social media, and video streaming) depend upon cloud infrastructure. Consider the classic application of web mail. Users are able to log on and access their web mail from any device, send and receive mail, and seemingly never run out of storage space. Interested organizations can in turn "rent" cloud email services to provide email to their own clients and employees, without incurring the hardware and maintenance cost of running the service themselves. Services in the SaaS pillar are managed completely by cloud providers; organizations and users do not (beyond configuring a few settings, perhaps) manage any part of the application, data, software, or hardware infrastructure, all which would be necessary if they were trying to set up the service on their own hardware. Prior to the advent of cloud computing, organizations interested in providing web mail for their users would need their own infrastructure and dedicated IT support staff to maintain it. Popular examples of SaaS providers include Google’s G Suite and Microsoft’s Office 365.
Infrastructure as a Service
Infrastructure as a service (IaaS) allows people and organizations to "rent out" computational resources to meet their needs, usually in the form of accessing virtual machines that are either general purpose or preconfigured for a particular application. One classic example is Amazon’s Elastic Compute Cloud (EC2) service from Amazon Web Services (AWS). EC2 enables users to create fully customizable virtual machines. The term elastic in EC2 refers to a user’s ability to grow or shrink their compute resource requests as needed, paying as they go. For example, an organization may use an IaaS provider to host its website or deploy its own series of custom-built applications to users. Some research labs and classrooms use IaaS services in lieu of lab machines, running experiments in the cloud or offering a virtual platform for their students to learn. In all cases, the goal is to eliminate the maintenance and capital needed to maintain a personal cluster or server for similar purposes. Unlike use cases in the SaaS pillar, use cases in the IaaS pillar require clients to configure applications, data, and in some cases the virtual machine’s OS itself. However, the host OS and hardware infrastructure is set up and managed by the cloud provider. Popular IaaS providers include Amazon AWS, Google Cloud Services, and Microsoft Azure.
Platform as a Service
Platform as a service (PaaS) allows individuals and organizations to develop and deploy their own web applications for the cloud, eliminating the need for local configuration or maintenance. Most PaaS providers enable developers to write their applications in a variety of languages and offer a choice of APIs to use. For example, Microsoft Azure’s service allows users to code web applications in the Visual Studio IDE and deploy their applications to Azure for testing. Google App Engine enables developers to build and test custom mobile applications in the cloud in a variety of languages. Heroku and CloudBees are other prominent examples. Note that developers have control over their applications and data only; the cloud provider controls the rest of the software infrastructure and all of the underlying hardware infrastructure.
15.3.2. MapReduce
Perhaps the most famous programming paradigm used on cloud systems is MapReduce3. Although MapReduce’s origins lay in functional programming’s Map and Reduce operations, Google was the first to apply the concept to analyzing large quantities of web data. MapReduce enabled Google to perform web queries faster than its competitors, and enabled Google’s meteoric rise as the go-to web service provider and internet giant it is today.
Understanding Map and Reduce Operations
The map and reduce functions in the MapReduce paradigm are based on the mathematical
operations of Map and Reduce from functional programming. In this section, we briefly discuss
how these mathematical operations work by revisiting some examples presented earlier in the book.
The Map operation typically applies the same function to all the elements in a collection. Readers familiar with Python may recognize this functionality most readily in the list comprehension feature in Python. For example, the following two code snippets in Table 1 perform scalar multiplication in Python:
| Regular scalar multiply | Scalar multiply with list comprehension |
|---|---|
|
|
The list comprehension applies the same function (in this case, multiplying an array element
with scalar value s) to every element x in array.
A single Reduce operation takes a collection of elements and combines them together into a single value
using some common function. For example, the Python function sum acts similarly to a Reduce operation, as it takes a
collection (typically a Python list) and combines all the elements together using addition.
So, for example, applying addition to all the elements in the result array returned from the scalarMultiply function in Table 1
yields a combined sum of 50.
The MapReduce Programming Model
A key feature of MapReduce is its simplified programming model. Developers
need to implement only two types of functions, map and reduce; the underlying
MapReduce framework automates the rest of the work.
The programmer-written map function takes an input (key,value) pair and outputs a series of intermediate
(key,value) pairs that are written to a distributed filesystem shared among all the nodes.
A combiner that is typically defined by the MapReduce framework then aggregates (key,value) pairs
by key, to produce (key,list(value)) pairs that are passed to the programmer-defined reduce
function. The reduce function then takes as input a (key,list(value)) pair
and combines all the values together through some programmer-defined operation to form a final
(key,value), where the value in this output corresponds to the result of the reduction operation.
The output from the reduce function is written to the distributed filesystem and usually
output to the user.
To illustrate how to use the MapReduce model to parallelize a program, we discuss the Word Frequency program. The goal of Word Frequency is to determine the frequency of each word in a large text corpus.
A C programmer may implement the following map function for the Word Frequency program:3
void map(char *key, char *value) {
    // key is document name
    // value is string containing some words (separated by spaces)
    int i;
    int numWords = 0; // number of words found: populated by parseWords()

    // returns an array of numWords words
    char *words[] = parseWords(value, &numWords);
    for (i = 0; i < numWords; i++) {
        // output (word, 1) key-value intermediate to file system
        emit(words[i], "1");
    }
}
This map function receives as input a string (key) that corresponds to the name of the file, and
a separate string (value) that contains a component of file data. The function then parses words from the
input value and emits each word (words[i]) separately with the string value "1". The emit function is provided by
the MapReduce framework and writes the intermediate (key,value) pairs to the distributed filesystem.
To complete the Word Frequency program, a programmer may implement the following reduce function:
void reduce(char *key, struct Iterator values) {
    // key is individual word
    // value is of type Iterator (a struct that consists of
    // a items array (type char **), and its associated length (type int))
    int numWords = values.length();  // get length
    char *counts[] = values.items(); // get counts
    int i, total = 0;
    for (i = 0; i < numWords; i++) {
        total += atoi(counts[i]); // sum up all counts
    }
    char *stringTotal = itoa(total); // convert total to a string
    emit(key, stringTotal); // output (word, total) pair to file system
}
This reduce function receives as input a string (key) that corresponds to a particular word,
and an Iterator struct (again, provided by the MapReduce framework) that
consists of an aggregated array of items associated with the key (items), and the length of that array (length). In the
Word Frequency application, items corresponds to a list of counts. The function then extracts the number of words from the
length field of the Iterator struct, and the array of counts from the items field. It then loops over all the counts, aggregating the
values into the variable total. Since the emit function requires char * parameters, the function converts total to a string prior to
calling emit.
After implementing map and reduce, the programmer’s responsibility ends. The MapReduce framework automates the rest of the work, including
partitioning the input, generating and managing the processes that run the map function (map tasks), aggregating and sorting intermediate (key,value)
pairs, generating and managing the separate processes that run the reduce function (reduce tasks), and generating a final output file.
For simplicity, in Figure 2 we illustrate how MapReduce parallelizes the opening lines of the popular Jonathan Coulton song "Code Monkey": code monkey get up get coffee, code monkey go to job.
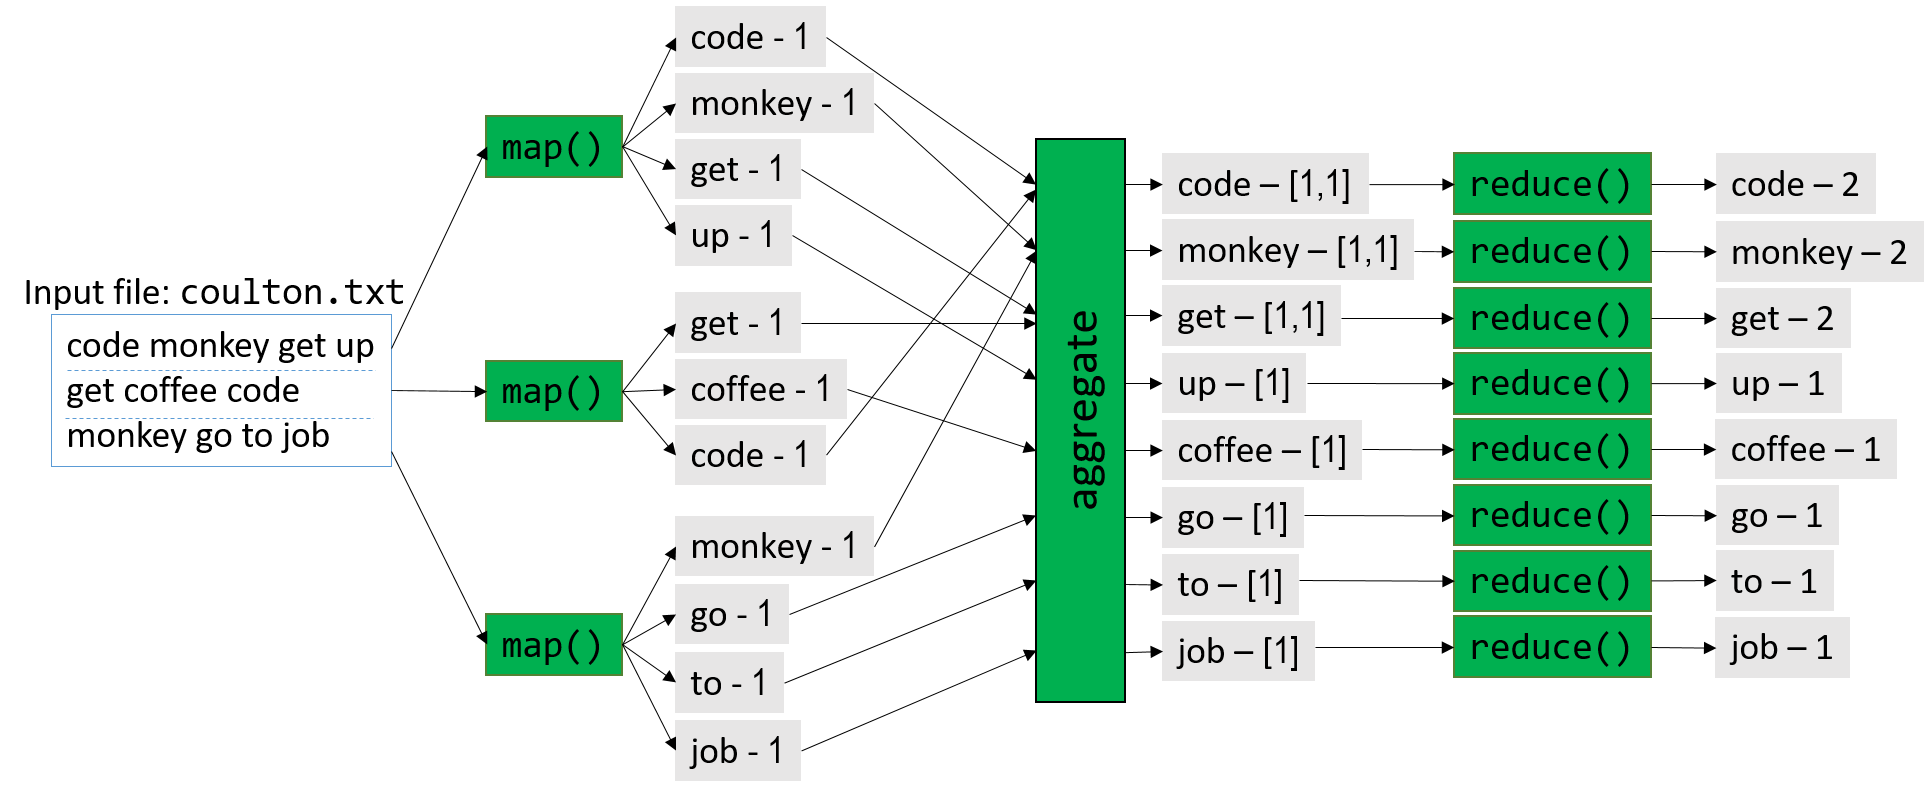
Figure 2 gives an overview of this process. Prior to execution, the boss node first partitions the input into M parts, where
M corresponds to the number of map tasks. In Figure 2, M = 3, and the input file (coulton.txt) is split into three parts.
During the map phase, the boss node distributes the map tasks among one or more worker nodes, with each map task executing independently and in
parallel. For example, the first map task parses the snippet code monkey get up into separate
words and emits the following four (key,value) pairs: (code,1), (monkey,1), (get,1), (up,1).
Each map task then emits its intermediate values to a distributed filesystem that takes up a certain amount of storage on each node.
Prior to the start of the reduce phase, the framework aggregates and combines the intermediate (key,value)
pairs into (key,list(value)) pairs. In Figure 2, for example, the (key,value) pair (get,1) is emitted by two separate map tasks.
The MapReduce framework aggregates these separate (key,value) pairs into the single (key,list(value)) pair (get,[1,1]).
The aggregated intermediate pairs are written to the distributed filesystem on disk.
Next, the MapReduce framework directs the boss node to generate R reduce tasks. In Figure 2, R = 8. The framework then
distributes the tasks among its worker nodes. Once again, each reduce task executes independently and in parallel. In the
reduce phase of this example, the (key,list(value)) pair (get,[1,1]) is reduced to the (key,value) pair (get,2).
Each worker node appends the output of its set of reduce tasks to a final file, which is available to the user upon completion.
Fault Tolerance
Data centers typically contain thousands of nodes. Consequently, the rate of failure is high; consider that if an individual node in a data center has a 2% chance of hardware failure, there is a greater than 99.99% chance that some node in a 1,000-node data center will fail. Software written for data centers must therefore be fault tolerant, meaning that is must be able to continue operation in the face of hardware failures (or else fail gracefully).
MapReduce was designed with fault tolerance in mind. For any MapReduce run, there is one boss node and potentially thousands of worker nodes. The chance that a worker node will fail is therefore high. To remedy this, the boss node pings individual worker nodes periodically. If the boss node does not receive a response from a worker node, the boss redistributes the worker’s assigned workload to a different node and re-executes the task3. If the boss node fails (a low probability given that it is only one node), the MapReduce job aborts and must be rerun on a separate node. Note that sometimes a worker node may fail to respond to the boss node’s pings because the worker is bogged down by tasks. MapReduce therefore uses the same pinging and work redistribution strategy to limit the effect of slow (or straggler) worker nodes.
Hadoop and Apache Spark
The development of MapReduce took the computing world by storm. However, Google’s implementation of MapReduce is closed source. As a result, engineers at Yahoo! developed Hadoop, an open source implementation of MapReduce, which was later adopted by the Apache Foundation. The Hadoop project consists of an ecosystem of tools for Apache Hadoop, including the Hadoop Distributed File System or HDFS (an open source alternative to Google File System), and HBase (modeled after Google’s BigTable).
Hadoop has a few key limitations. First, it is difficult to chain multiple MapReduce jobs together into a larger workflow. Second, the writing of intermediates to the HDFS proves to be a bottleneck, especially for small jobs (smaller than one gigabyte). Apache Spark was designed to address these issues, among others. Due to its optimizations and ability to largely process intermediate data in memory, Apache Spark is up to 100 times faster than Hadoop on some applications4.
15.3.3. Looking Toward the Future: Opportunities and Challenges
Despite the innovations in the internet data analytics community, the amount of data produced by humanity continues to grow. Most new data is produced in so-called edge environments, or near sensors and other data-generating instruments that are by definition on the other end of the network from commercial cloud providers and HPC systems. Traditionally, scientists and practitioners gather data and analyze it using a local cluster, or move it to a supercomputer or data center for analysis. This "centralized" view of computing is no longer a viable strategy as improvements in sensor technology have exacerbated the data deluge.
One reason for this explosive growth is the proliferation of small internet-enabled devices that contain a variety of sensors. These Internet of Things (IoT) devices have led to the generation of large and diverse datasets in edge environments. Transferring large datasets from the edge to the cloud is difficult, as larger datasets take more time and energy to move. To mitigate the logistic issues of so-called "Big Data", the research community has begun to create techniques that aggressively summarize data at each transfer point between the edge and the cloud2. There is intense interest in the computing research community in creating infrastructure that is capable of processing, storing, and summarizing data in edge environments in a unified platform; this area is known as edge (or fog) computing. Edge computing flips the traditional analysis model of Big Data; instead of analysis occurring at the supercomputer or data center ("last mile"), analysis instead occurs at the source of data production ("first mile")2.
In addition to data movement logistics, the other cross-cutting concern for the analysis of Big Data is power management. Large, centralized resources such as supercomputers and data centers require a lot of energy; modern supercomputers require several megawatts (million watts) to power and cool. An old adage in the supercomputing community is that "a megawatt costs a megabuck"; in other words, it costs roughly $1 million annually to maintain the power requirement of one megawatt5. Local data processing in edge environments helps mitigate the logistical issue of moving large datasets, but the computing infrastructure in such environments must likewise use the minimal energy possible2. At the same time, increasing the energy efficiency of large supercomputers and data centers is paramount5.
There is also interest in figuring out ways to converge the HPC and cloud computing ecosystems to create a common set of frameworks, infrastructure and tools for large-scale data analysis. In recent years, many scientists have used techniques and tools developed by researchers in the cloud computing community to analyze traditional HPC datasets, and vice versa. Converging these two software ecosystems will allow for the cross-pollination of research and lead to the development of a unified system that allows both communities to tackle the coming onslaught of data, and potentially share resources. The Big Data Exascale Computing (BDEC) working group argues that instead of seeing HPC and cloud computing as two fundamentally different paradigms, it is perhaps more useful to view cloud computing as a "digitally empowered" phase of scientific computing, in which data sources are increasingly generated over the internet2. In addition, a convergence of culture, training, and tools is necessary to fully integrate the HPC and cloud computing software and research communities. BDEC also suggests a model in which supercomputers and data centers are "nodes" in a very large network of computing resources, all working in concert to deal with data flooding from multiple sources2. Each node aggressively summarizes the data flowing to it, releasing it to a larger computational resource node only when necessary.
As the cloud computing and HPC ecosystems look for unification and gird themselves against an increasing onslaught of data, the future of computer systems brims with exciting possibilities. New fields like artificial intelligence and quantum computing are leading to the creation of new domain-specific architectures (DSAs) and application-specific integrated circuits (ASICS) that will be able to handle custom workflows more energy efficiently than before (see the TPU6 for one example). In addition, the security of such architectures, long overlooked by the community, will become critical as the data they analyze increases in importance. New architectures will also lead to new languages needed to program them, and perhaps even new operating systems to manage their various interfaces. To learn more about what the future of computer architecture may look like, we encourage readers to peruse this article by the 2017 ACM Turing Award winners and computer architecture giants, John Hennessy and David Patterson7.
References:
-
Armbrust et. al. "A view of cloud computing". CACM 53(4). 2010.
-
Asch et. al. "Big data and extreme-scale computing: Pathways to Convergence-Toward a shaping strategy for a future software and data ecosystem for scientific inquiry". The International Journal of High Performance Computing Applications 32(4), 435–479. 2018.
-
Dean and Ghemawat. "MapReduce: Simplified Data Processing on Large Clusters". USENIX. 2004.
-
DataBricks. "Apache Spark". https://databricks.com/spark/about
-
M. Halper. "Supercomputing’s Super Energy Needs, and What to Do About Them". CACM News: https://cacm.acm.org/news/192296-supercomputings-super-energy-needs-and-what-to-do-about-them/fulltext
-
Jouppi et. al. "In-datacenter performance analysis of a tensor processing unit". 2017 ACM/IEEE 44th Annual International Symposium on Computer Architecture (ISCA), pp. 1-12. 2017.
-
J. Hennessy and D. Patterson. "A New Golden Age for Computer Architecture". CACM 62(2), 48-60. 2019.
-
D. A. Reed and J. Dongarra. "Exascale computing and big data". CACM 58(7), 56–68. 2015.