17.16. Getting System Information
There are many tools available for obtaining information about the system’s
state: top and htop provide dynamic summary information about system
resources and resource use, such as CPU and memory use; and
the /proc and /sys pseudo file systems contain detailed
information about the current state of the system
(there are also commands like lscpu, lsmem, and lsgpu
that display some information from /proc and /sys in an easier
to read form).
17.16.1. top and htop
Running top or htop at the command line provides dynamic summary
information about the state of the system. Typing q quits top and htop.
Both show memory and CPU usage information, but htop displays some of the
usage statistics more graphically than top does, particularly showing memory
usage and each core’s CPU utilization as a graph. Both also, by default, list
information about the tasks currently using the most CPU time.
A task is the Linux generic term for either a process or a thread,
These tools update every second as they run, showing changes in summary system
use data. Note that as the display updates every second, the ordering of
processes will change as they execute according to how much CPU time they are
using. Both are also very configurable to display different information
about processes and system state.
Figure 1 shows an example screenshot from htop.
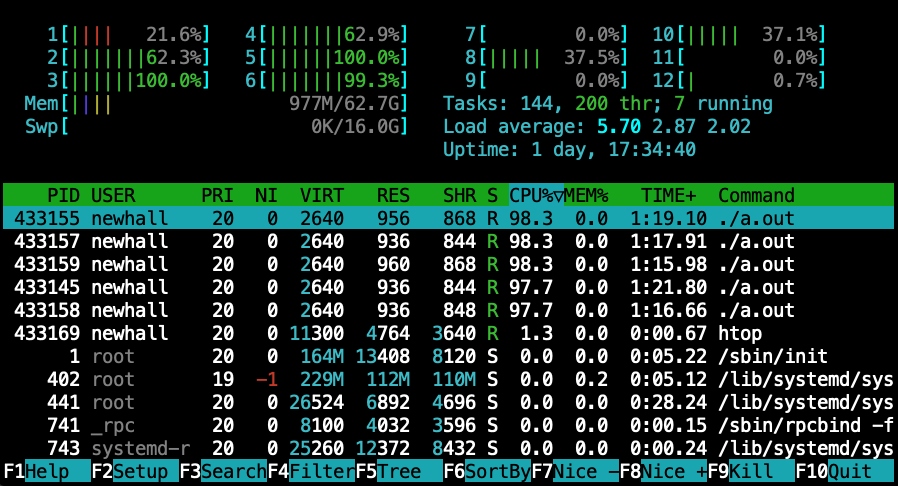
At the very top, htop displays the current CPU usage of each of the 12 cores
on this system as a usage graph annotated with percentages, followed the
current memory usage (Mem), summary information about the average CPU load
(Load average), the total number of tasks (Tasks) and threads (thr)
running in the system, and information about swap partition usage (Swp).
Under these is a listing of the tasks using the most CPU time in
the systems. Note that in Figure 1 the top five tasks listed
are processes running the a.out infinite loop program, and thus they are
unsurprisingly using up a lot of CPU time. At the bottom of the display are
function keys for changing the data presented in different ways.
The top program displays very similar data to htop (but without the
graphical displays at the top), and it similarly provides an interface
to change the data presented in different ways as it runs.
For example, users can view the CPU usage per core in top by hitting the
“1” key.
In addition to being very configurable when running, both top and htop have
a large number of command line options to configure what they show and how they
show it. For example, by default top does not show per-thread statistics
(only per-process), but by running with the -H command line option it will.
17.16.2. /proc and /sys
/proc and /sys are pseudo file systems that provide access to
operating system information about process running in the system and
to information about system state and resources (e.g., devices, buses,
memory, cpu). A pseudo file system looks like a file
system and can be interacted with via the filesystem interface, but
it doesn’t actually store file data. Instead, through pseudo
files in /proc and /sys a user can interact with the operating
system; reading from pseudo files in /proc and /sys
(e.g., cat /proc/filename) is a way
to obtain information about system state from the OS. Some files in
/proc and /sys can also be written
to, which can trigger the OS to change a policy or change the state
associated with a particular process or resource in the system.
For example, a debugger like GDB may write into a /proc file associated
with the process it is debugging to set a breakpoint, or it may read
from a /proc file to examine the current contents of its stack memory.
Below are a few examples of the type of information that can be obtained
from reading files in /proc. In our section on
caching on multicore processors
we show some examples of how to get information about
CPU caches from files in /sys.
Each process running in the system has a subdirectory in /proc named with
its process ID that contains many pseudo files that are interfaces to the
process’s state and status. For example, suppose we want to get some
information from /proc about the a.out process running in the background
like this:
$ ./a.out &
We first get its process ID by running the ps command:
$ ps
    PID TTY          TIME CMD
 246477 pts/0    00:00:00 bash
 246541 pts/0    00:01:59 a.out
 246879 pts/0    00:00:00 ps
We can then use file system commands to get information about the
running a.out program using its process ID 246541 (and note that
you can only access subdirectories in /proc associated with processes
that you own). For example:
$ ls /proc/246541/         # list all pseudo files for this process

$ cat /proc/246541/comm    # list its executable file name
$ cat /proc/246541/status  # list its status information
The status pseudo file lists a lot of information, including the following:
State: R (running)  # its state: running, blocked, exited, ...
VmStk: 132 kB       # size of its stack (in its virtual memory (Vm))
nonvoluntary_ctxt_switches:  59593   # context switches due to OS CPU scheduling
This example a.out program contains an infinite loop; as it continues to run,
the number of context switches increases, and its state will always be R (for
running), until it is killed with CTRL-C.
Pseudo files in /proc (and in /sys) can also be used to get information
from the OS about system-wide resources. Here are some examples of
getting information from /proc (in the Memory Hierarchy chapter we
show an example of getting
caching on multicore processors
from /sys):
cat /proc/meminfo    # info about system memory and its current use
cat /proc/cpuinfo    # info about each hyperthreaded core
cat /proc/swaps      # info about swap partitions and their use
cat /proc/stat       # lots of system statistics
Linux provides utilities that summarize some information in
/proc and /sys in a form that is often easier to read than
the output from directly reading files in /proc and /sys.
The lshw, lscpu, and lsgpu are example commands that list
information about the system hardware, the CPU, and GPU devices on a machine.
For example, to find the number of physical cores on a machine a user
cat run lscpu:
CPU(s):                          32
On-line CPU(s) list:             0-31
Thread(s) per core:              2
Core(s) per socket:              8
Socket(s):                       2
The output shows that there are a total of 16 physical cores on the
machine (2 Sockets/chips, and 8 cores per socket/chip). It
also shows that each core is dual-hyperthreaded (2 Thread(s) per core),
to make the 16-core machine appear to the operating system a 32-core
machine.
Please note that newer Intel architectures introduce P-cores and E-cores. For
these architectures, the total listed CPU(s) may be higher than the number of
physical cores multiplied by the number of sockets and hardware threads. See
Chapter
14 for more information.
17.16.3. References
For more information see:
-
The man pages:
man 5 proc,man 5 sysfs,man lscpu, manlsmem -
some information about /proc from The Linux Documentation Project
-
/proc/stat explained from linuxhowtos.org